Alloy metals can exist in different phases. Phases are physically homogeneous states of an alloy. A phase has a precise chemical composition – a certain arrangement and bonding between the atoms.
This structure of atoms imparts different properties to different phases. We can choose the phase we want and use it in our applications.
Only some special alloys can exist in multiple phases. Heating the metal to specific temperatures using heat treatment procedures results in different phases. Some special alloys can exist in more than one phase at the same temperature.
What Are Phase Diagrams?
Phase diagrams are graphical representations of the phases present in an alloy at different conditions of temperature, pressure, or chemical composition.
The diagram describes the suitable conditions for two or more phases to exist in equilibrium. For example, the water phase diagram describes a point (triple point) where water can coexist in three different phases at the same time. This happens at just above the freezing temperature (0.01°C) and 0.006 atm.
Using the Diagrams
There are four major uses of alloy phase diagrams:
- Development of new alloys based on application requirements.
- Production of these alloys.
- Development and control of appropriate heat treatment procedures, such as tempering, annealing, normalising, etc, to improve the chemical, physical, and mechanical properties of these new alloys.
- Troubleshooting problems that arise in the application of these new alloys, ultimately improving product predictability.
When it comes to alloy development, phase diagrams have helped prevent overdesign for applications. This keeps cost and process time down. They also help develop alternative alloys or the same alloys with alternative alloying elements. It can help to reduce the need for using scarce, hazardous, or expensive alloying elements.
Performance-wise, phase diagrams help metallurgists understand which phases are thermodynamically stable, metastable, or unstable in the long run. Appropriate elements can then be chosen for alloying to prevent machinery breakdown. Material for exhaust piping, for example, if not chosen properly, may lead to a breakdown at higher temperatures.
The service life also improves as phase diagrams show us how to solve problems such as intergranular corrosion, hot corrosion, and hydrogen damage.
Iron-Carbon Phase Diagram
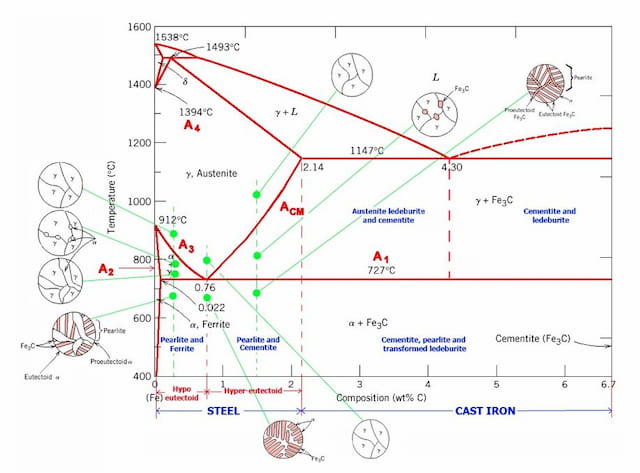
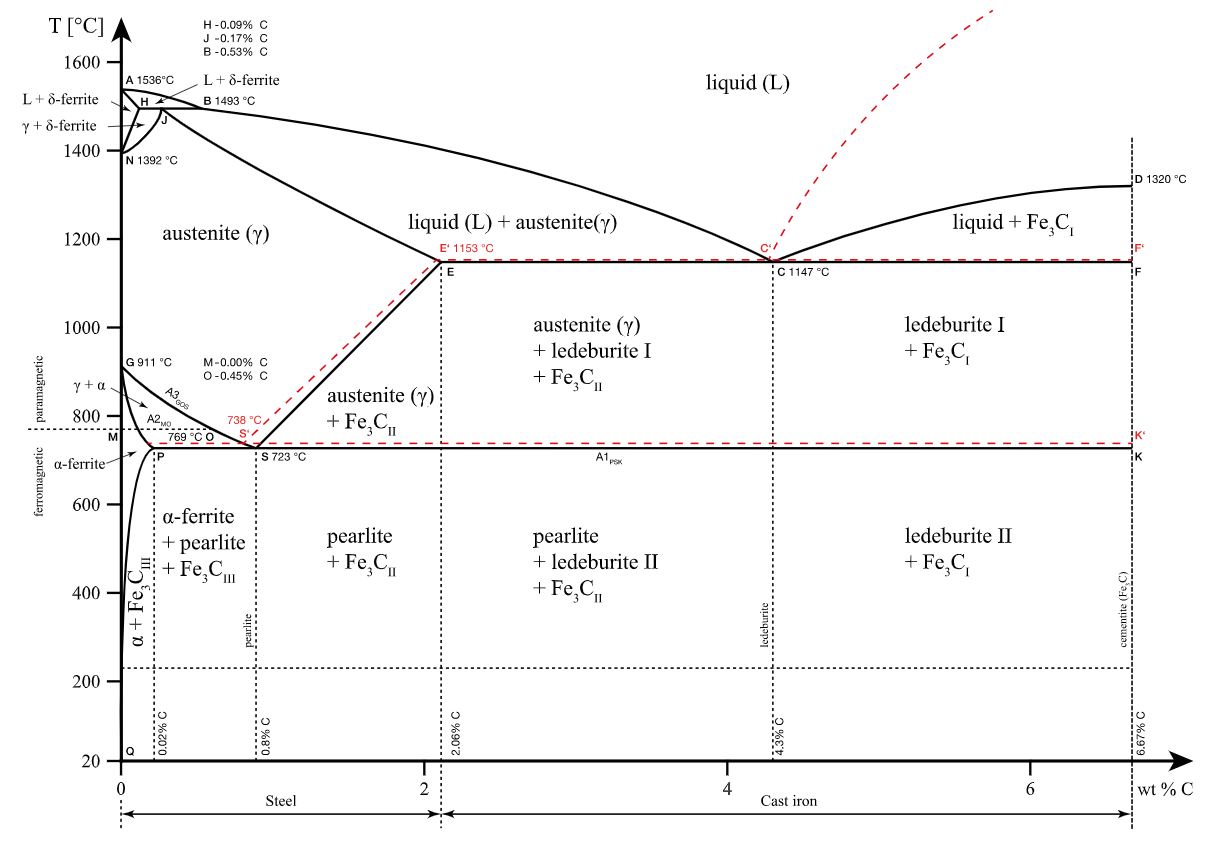
The iron-carbon phase diagram is widely used to understand the different phases of steel and cast iron. Both steel and cast iron are a mix of iron and carbon. Also, both alloys contain a small amount of trace elements.
The graph is quite complex, but since we are limiting our exploration to Fe3C, we will only be focusing on up to 6.67 weight percent of carbon.
This iron-carbon phase diagram is plotted with the carbon concentrations by weight on the X-axis and the temperature scale on the Y-axis.

ARVE error: url: https://www.googleapis.com/youtube/v3/videos?part=snippet%2Cstatistics&id=tYk5NMylHc0&key=AIzaSyAQ7WFzTAUrOX-FjsIrFS3JwZBFzgIvloc Status code 200 expected but was 403.
The carbon in iron is an interstitial impurity. The alloy may form a face-centred cubic (FCC) lattice or a body-centred cubic (BCC) lattice. It will form a solid solution with α, γ, and δ phases of iron.
Types of Ferrous Alloys on the Phase Diagram
The weight percentage scale on the X-axis of the iron-carbon phase diagram goes from 0% up to 6.67% Carbon. Up to a maximum carbon content of 0.008% weight of Carbon, the metal is simply called iron or pure iron. It exists in the α-ferrite form at room temperature.
From 0.008% up to 2.14% carbon content, the iron-carbon alloy is called steel. Within this range, there are different grades of steel known as low-carbon steel (or mild steel), medium-carbon steel, and high-carbon steel.
When the carbon content increases beyond 2.14%, we reach the stage of cast iron. Cast iron is very hard, but its brittleness severely limits its applications and methods for forming.
Boundaries
Multiple lines can be seen in the diagram titled A1, A2, A3, A4, and ACM. The A in their name stands for the word ‘arrest’. As the temperature of the metal increases or decreases, a phase change occurs at these boundaries when the temperature reaches the value on the boundary.
Normally, when heating an alloy, its temperature increases. But along these lines (A1, A2, A3, A4, and ACM), the heating results in a realignment of the structure into a different phase and thus, the temperature stops increasing until the phase has changed completely. This is known as thermal arrest, as the temperature stays constant.
Alloy steel elements such as nickel, manganese, chromium, and molybdenum affect the position of these boundaries on the phase diagram. The boundaries may shift in either direction depending on the element used. For example, in the iron-carbon phase diagram, the addition of nickel lowers the A3 boundary while the addition of chromium raises it.
Eutectic Point
Eutectic point is a point where multiple phases meet. For the iron-carbon alloy diagram, the eutectic point is where the lines A1, A3 and ACM meet. The formation of these points is coincidental.
At these points, eutectic reactions take place where a liquid phase freezes into a mixture of two solid phases. This happens when cooling a liquid alloy of eutectic composition all the way to its eutectic temperature.
The alloys formed at this point are known as eutectic alloys. On the left and right side of this point, alloys are known as hypoeutectic and hypereutectic alloys, respectively (‘hypo’ in Greek means less than, ‘hyper’ means greater than).
Phase Fields
The boundaries, intersecting each other, mark certain regions on the Fe3C diagram.
Within each region, a different phase or two phases may exist together. At the boundary, the phase change occurs. These regions are the phase fields.
They indicate the phases present for a certain composition and temperature of the alloy. Let’s learn a little about the different phases of the iron-carbon alloy.
- Personal account manager
- Quality assurance
- Payment terms for companies
- On-time delivery by Fractory
Different Phases
α-ferrite
Existing at low temperatures and low carbon content, α-ferrite is a solid solution of carbon in BCC Fe. This phase is stable at room temperature. In the graph, it can be seen as a sliver on the left edge with the Y-axis on the left side and A2 on the right. This phase is magnetic below 768°C.
It has a maximum carbon content of 0.022 %, and it will transform to γ-austenite at 912°C, as shown in the graph.
γ-austenite
This phase is a solid solution of carbon in FCC Fe with a maximum solubility of 2.14% C. On further heating, it converts into BCC δ-ferrite at 1395°C. γ-austenite is unstable at temperatures below the eutectic temperature (727°C) unless cooled rapidly. This phase is non-magnetic.
δ-ferrite
This phase has a similar structure to α-ferrite but exists only at high temperatures. The phase can be spotted at the top left corner on the graph. It has a melting point of 1538°C.
Fe3C or cementite
Cementite is a metastable phase of this alloy with a fixed composition of Fe3C. It decomposes extremely slowly at room temperature into iron and carbon (graphite).
This decomposition time is long, and it will take much longer than the service life of the application at room temperature. Some other factors (high temperatures and the addition of certain alloying elements, for instance) can affect this decomposition as they promote graphite formation.
Cementite is hard and brittle, which makes it suitable for strengthening steels. Its mechanical properties are a function of its microstructure, which depends upon how it is mixed with ferrite.
Fe-C liquid solution
Marked on the diagram as ‘L’, it can be seen in the upper region on the diagram. As the name suggests, it is a liquid solution of carbon in iron. As we know that δ-ferrite melts at 1538°C, it is evident that the melting temperature of iron decreases with increasing carbon content.
Fractory offers metal fabrication services, such as laser cutting, sheet metal bending, CNC machining, etc, for a wide range of steels and other metals. If you don’t find suitable material on our platform, please contact our sales engineers, since they are most likely still able to accommodate your needs.